Teste de comparação de médias
As médias podem ser obtidas da seguinte maneira:
> tapply(morango$resp, morango$trat, mean)
        A         C         G         L
0.1711125 0.2212875 0.4393375 0.1794000
O teste de Tukey é realizado da seguinte forma:
> morango.tu <- TukeyHSD(morango.av)
> morango.tu
  Tukey multiple comparisons of means
    95% family-wise confidence level

Fit: aov(formula = resp ~ trat, data = morango)

$trat
          diff         lwr         upr     p adj
C-A  0.0501750 -0.01692822  0.11727822 0.1973032
G-A  0.2682250  0.20112178  0.33532822 0.0000000
L-A  0.0082875 -0.05881572  0.07539072 0.9865109
G-C  0.2180500  0.15094678  0.28515322 0.0000000
L-C -0.0418875 -0.10899072  0.02521572 0.3404304
L-G -0.2599375 -0.32704072 -0.19283428 0.0000000
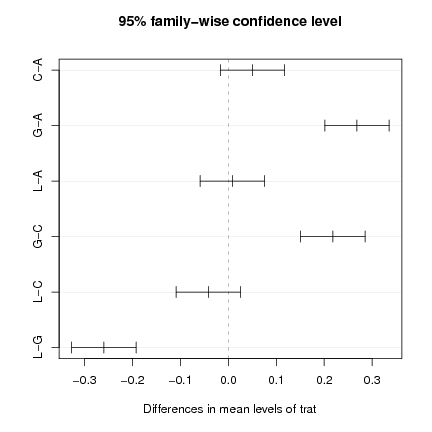
Para visualização de forma gráfica, basta apenas fazer um plot do objeto morango.tu:
> plot(morango.tu)
 No pacote agricolae há uma função que representa o resultado do teste de Tukey com as letras indicando os grupos.
> require(agricolae)
> df <- df.residual(morango.av)
> MSerror <- deviance(morango.av)/df
> tukey.tu <- HSD.test(morango$resp, morango$trat, df, MSerror,
+     group = TRUE, main = "Comparação de médias - morango")
Study: Comparação de médias - morango

HSD Test for morango$resp
                                          ......
Alpha                                0.050000000
Error Degrees of Freedom            28.000000000
Error Mean Square                    0.002416141
Critical Value of Studentized Range  3.861243662

Treatment Means
  morango.trat morango.resp    std.err replication
1            A    0.1711125 0.01162003           8
2            C    0.2212875 0.02418321           8
3            G    0.4393375 0.01797667           8
4            L    0.1794000 0.01284746           8

Honestly Significant Difference 0.06710322
Means with the same letter are not significantly different.

Groups, Treatments and means
a 	 G 	 0.4393375
 b 	 C 	 0.2212875
 b 	 L 	 0.1794
 b 	 A 	 0.1711125